Evaluation Units and Analysis Software
Expanded control with visualization and reporting
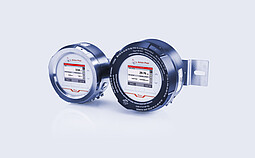
Benefit from over 40 years of experience in inline and laboratory beverage analysis: Connect Anton Paar’s versatile and well-proven evaluation units to all generations of Anton Paar density, sound velocity, concentration and CO2 sensors. Let the data acquisition and visualization software master complex measuring tasks for you – bringing home the precision that marks measurement solutions from Anton Paar.
Anton Paar Products
Unparalleled ease of operation
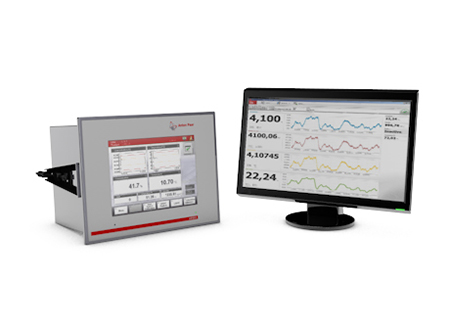
Connect to PCs throughout your organization via Ethernet; Anton Paar’s Davis 5 ensures seamless integration. Based on an open client/server architecture, the system stores production data on your server and enables it to be displayed simultaneously on multiple PCs throughout your enterprise network. View an active window displaying real-time values and graphical trends on remote screens anywhere on your site.
Safety through product-specific settings
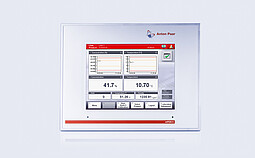
You can easily specify production settings, limits and alerts for individual products. Whenever measured values fall out of spec, screen color changes or an audible signal quickly alerts your team. Brand-specific settings, including target values and alarm limits, can be programmed for up to 999 beverages. Your team also benefits from the creation and management of a perfectly maintained products database.
User-friendly calibration and adjustment
Davis 5 helps you save time during routine operations by automatically comparing process results with laboratory reference values. The system’s calibration and adjustment are user-friendly and integrated with an automatic analysis function that eliminates human error. You can easily recognize drifts and other process inefficiencies and correct them on the fly.
Display trends and statistics
View initial values while the system continues to collect and store data. Production runs can be monitored from any office in the plant. Starts/stops, out-of-range values, trends, mean value, min./max., standard deviation, operating times, line downtimes, bottle/can numbers, history of adjustments and quality data (Cp, Cpk and Quality Index, etc.) can be monitored, viewed, e-mailed, downloaded, or printed.
Powerful reporting
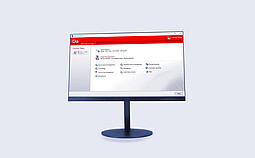
Davis 5 automates report generation according to your requirements. Users can transfer data to LIMS or send e-reports to a smartphone, tablet or PC. Statistical reports can be viewed in XML or PDF formats so they are easily readable by your corporate quality management system. The reports are accessible after each batch is run or at a specific time of day for your convenience.
Webinars

We offer you a great and constantly growing choice of live webinars and recordings on products, applications, and scientific topics.
View webinars